Extreme weather events, like catastrophic floods, are the malicious exclamation points of Earth’s chaotic and variable climate system; they arrive without warning and extract huge costs, both economic and humanitarian, from the communities they strike. Evidence suggests the frequency and severity of these events may be on the rise in a changing climate, but scientists struggle to place modern events in a longer historical context.
Information about the past hides in all kinds of places. The trick is figuring out how to extract it. Rudolf Brázdil and his team from Masaryk University in Brno have started using historical tax records from southern Moravia in the Czech Republic to reconstruct the flood history of the area, a test case for broader studies of this kind. At the EGU General Assembly, Brázdil sat down with Julia Rosen to explain his approach.
To start with, how did this idea occur to you?
Existing hydrological series based on instrumental records are generally short. To study really disastrous events, which have a long recurrence interval, you cannot use just the period of hydrological measurements, you have to extend it into the past. We are working in the field of historical hydrology using documentary sources to reconstruct past floods and we recognised that we can use this so-called taxation data. In the past, in Moravia, if anybody was affected by any disastrous events – like a flood – they had the opportunity to ask to pay lower taxes. It was a complicated administrative process, and we are studying documents related to this process to reconstruct hydrometeorological events – including floods. The idea is to obtain the longest series of extremes as possible.

A painting from 1846 commemorating the tragic Elbe flood of March 1845 in Ústí nad Labem, NW Bohemia. The peak discharge of this flood was not matched even by the disastrous August 2002 event. (Credit: Museum of the City of Ústí nad Labem, Oil on wood, painted shooting target, catalogue no. U 334)
How do you actually infer flood histories from these data?
Using this data, you can recognise the time and place of an event and its impacts. That’s because the original aim of these documents was to describe damage for which affected people could obtain some tax relief. Generally, you can use flood marks to determine the size of events. For example, people identified the height of the water on the bridge, or on the wall of the house. In Prague (where I have worked before) there is a statue – the head of a bearded man – that was installed in the 15th century. People have characterised floods with respect to how much of the head was submerged, or if it disappeared entirely, since 1481. People knew, for example, that if the water reached the head, they had to leave their houses.
You also know the flooded area by which villages or settlements have been affected. It is difficult to precisely compare the magnitude of historical floods with recent floods because of the totally different character of rivers in the past. They were not regulated – they had many meanders and the character of the landscape was different as well. But we can still compare events from the point of view of the frequency of floods, their seasonality and impacts.
What are the challenges of working with this kind of data? What are its limits?
Every proxy is limited from different points of view. One limitation of our data is incompleteness, both spatially and temporally. For example, you could have a situation where nobody recorded such events, although this is not so likely when events are really strong. Second, perhaps someone recorded it, but original records were lost in fires or during reorganisation of archives. Third, of course, it is generally qualitative information. You need to understand the nature of these data by collaborating with historians and archivists. I am a climatologist, and for me, it’s extremely important to cooperate with such people because without them, there wouldn’t be any historical hydrology. On the other, they would never use such data for the purposes for which we are using it. It is a classic example of interdisciplinary research.
What did you find? Has the frequency of extreme floods increased or decreased?
We are more or less at the beginning of this project using taxation records in Moravia. I am just now evaluating everything, so it’s difficult for me to say now. However, I can give you an example from Bohemia (the western part of the Czech Republic) where we have worked before using other kinds of documents. There, the 19th century was an extremely active period for floods, followed by the second part of the 16th century. The second part of the 20th century was very quiet in the Czech Lands, there were really no important floods until the disastrous floods of July 1997 in Moravia and August 2002, in Bohemia.
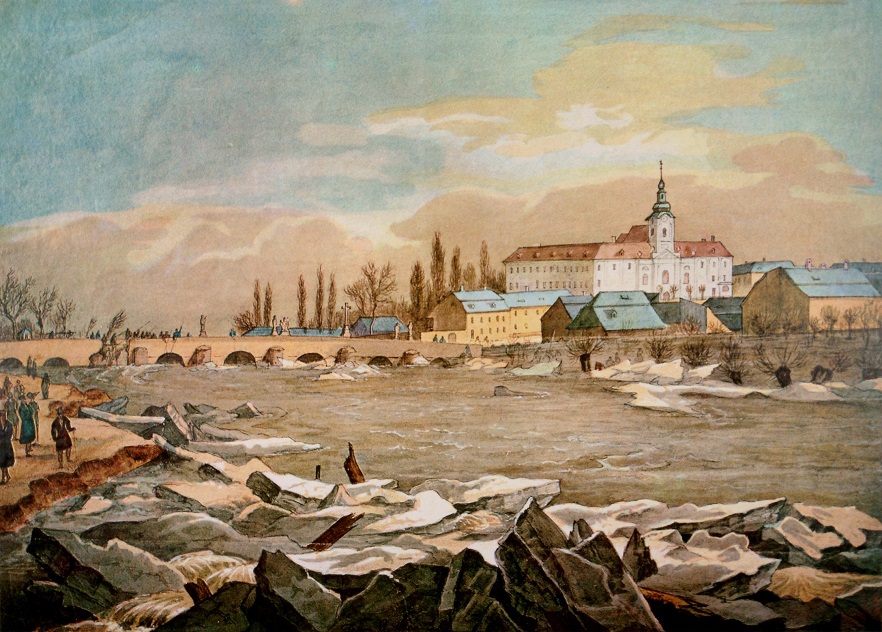
The Long Bridge across the River Svratka in Brno where ice floes accumulated during the flood of March 1830 after the extremely severe winter of 1829-1830. (Reproduction of a colour drawing by Frantisek Richter, Brno City Archives, Collection of graphics, prints and reprints, no. 255R)
What comes next?
For this project, the first step was tax records. The second step is family archives, which sometimes contain better information, and the third step is chronicles, then newspapers, and of course systematic hydrologic and meteorological measurements. This should form the main database to allow us to do our analysis and synthesis. Success will be if we are able to analyse in detail the spatial and temporal variability of hydrometeorological extremes for the last 350 or 400 years and to use this information for estimates of future extremes.
It will also be a success for us if our work gains acceptance within the international community. This will demonstrate that we are presenting new and interesting results and new methodological approaches that might be applicable on a broader scale. I believe these taxation data are available in many European countries and it would help to extend our knowledge about past floods in this area.
By Julia Rosen, PhD, Freelance Science Writer
Acknowledgement:
The project is financed by the Czech Republic Grant Agency.


Pingback: An upshot of taxes? They document historical floods. | julia rosen