On the desolate Antarctic peninsula, a colony of penguins creates a hub of biodiversity. One may ask, how exactly do those aquatic birds help maintain and enrich the variety of different kinds of organisms from plants and animals, to a wide range of insects and micro-organisms that live on our planet? The answer is quite intriguing. Scientists from the University of Science and Technology of China ...[Read More]
Predators or gardeners: how penguins fertilise Antarctica’s biodiversity
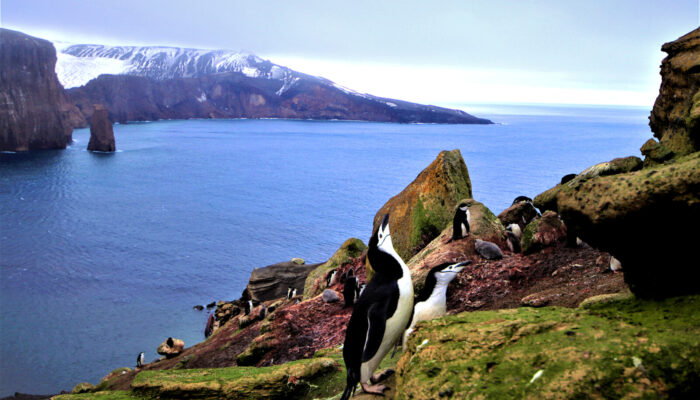
Sea birds contribute importantly to biogeochemical cycles in coastal ecosystems and on islands. Feeding on the marine food chain and nesting on land, they carry large amounts of marine nutrients into terrestrial ecosystems. This might be of particular importance for the nitrogen (N) cycle of terrestrial ecosystems in the antarctic. Credit: Daniel Wasner (distributed via imaggeo.egu.eu)