Hi Morelia. Thank you for joining us today! Could you tell our readers a bit about yourself and your research? Hi, I am Junior Professor for Marine Geomechanics at GEOMAR Helmholtz Centre for Ocean Research Kiel and Kiel University in Germany. I graduated at the University of Bremen (Germany) and did my PhD in 2013 at the National Oceanography Centre Southampton in the UK. After a short postdoc th ...[Read More]
GeoTalk: meet Morelia Urlaub, researcher of underwater landslides!
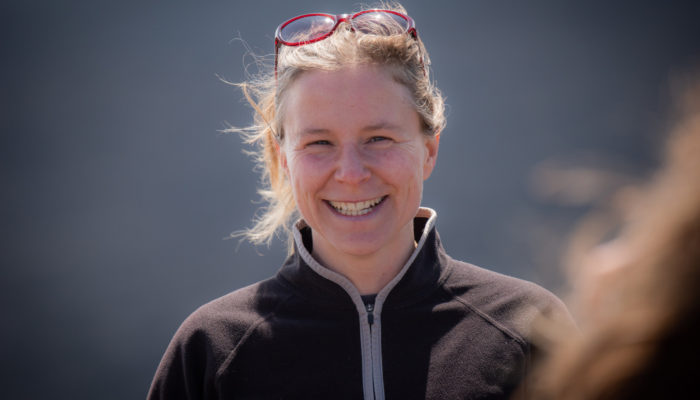
Morelia Urlaub